
FTIR Fourier Transform Infrared Spectroscopy
Fourier Transform Infrared Spectroscopy (FTIRis a spectroscopic technique that uses the infrared light absorption characteristics to analyze the organic components of materials.
FTIR transmissionan InterferometerGenerate an interferogram, and then througha Fourier TransformConvert to infrared light spectrum.
When infrared light shines on the sample, the organic chemical bonds in the organic molecules absorb infrared light of specific wavelengths, causing the organic molecules to generateVibrational and rotational energy level changesTherefore, different organic chemical bonds correspond to different absorption peaks.
By analyzing the position and intensity of each absorption peak in the organic analysis spectrum, one can determine the material'sorganicFunctional Group and Organic Molecule Structure。
FTIR belongs tonon-destructive analysis technologyThe absorption of the sample to infrared light is often represented by plotting the **transmittance against wavenumber**.
Common measurement modes include:
-
Transmission
-
Attenuated Total Reflection (ATR)
The general infrared analysis wavenumber range is:
4000 – 650 cm⁻¹
Analysis of Surface Organic Unknowns
Through database comparison and analysis of the spectral fingerprint region, the organic chemical functional groups and composition in the material can be identified.
General recommended sample size:
-
area> 50 µm
-
thickness1 µm
If the sample size is smaller, a further assessment of suitable analysis methods can be made.
Qualitative comparison analysis
The organic spectrum of the sample can be compared with the spectra of known organic materials, for example:
-
Comparison of process materials and organic pollutants
-
Comparison between normal area and abnormal area
-
Comparison of standard samples and test samples
semi-quantitative analysis
Semi-quantitative analysis is usually recommended to provide through the establishment of a calibration curve:
7 different concentration standard samples
to establish the relationship between concentration and absorption intensity.
Mapping analysis
FTIR can be performedMicro-area spectral mappingAnalyzing the concentration distribution of organic functional groups in the specified area.
e.g.,
-
Analysis area:30 µm × 30 µm
-
Simultaneously obtainedSpectral information and spatial distribution map
Can be used to study the distribution changes of material composition in micro-regions.
-
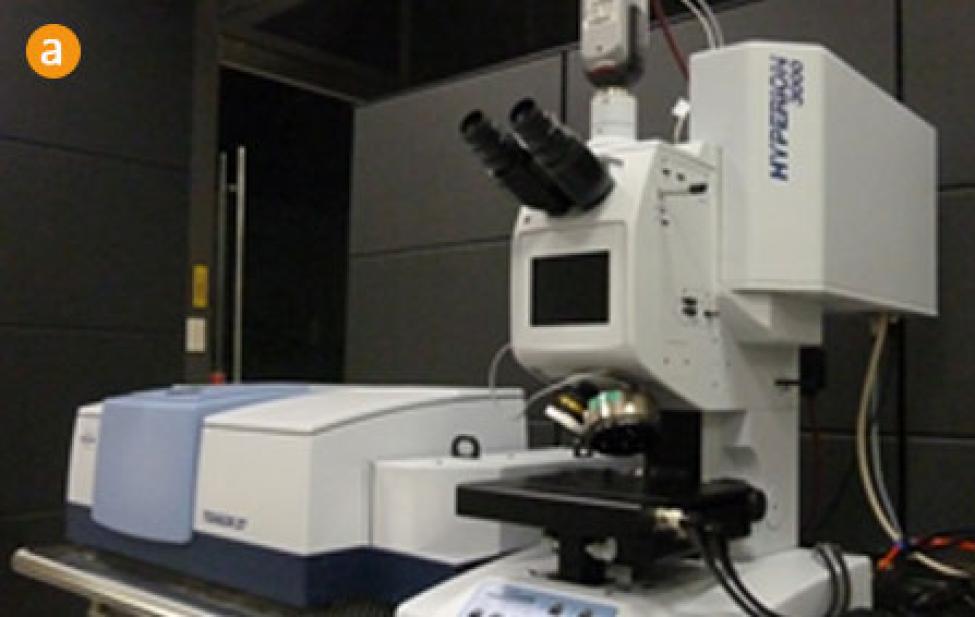
(a) Micro FTIR (Bruker Tensor 27+Hyperion 3000)
This system isMicro Fourier Transform Infrared Spectrometer (Micro-FTIR)Combining the Bruker Tensor 27 FTIR main unit with the Hyperion 3000 microscopic system allows for micro-area infrared spectral analysis. Through the optical system of the microscope, small areas on the sample can be precisely located to obtain infrared light spectra, suitable forMicro-area analysis of organic pollutants, organic thin film residues, and organic material composition.. It can also Can measure in the scale of tens of micrometers, used for organic pollution analysis in semiconductor processes, material defect analysis, and particle identification.
-
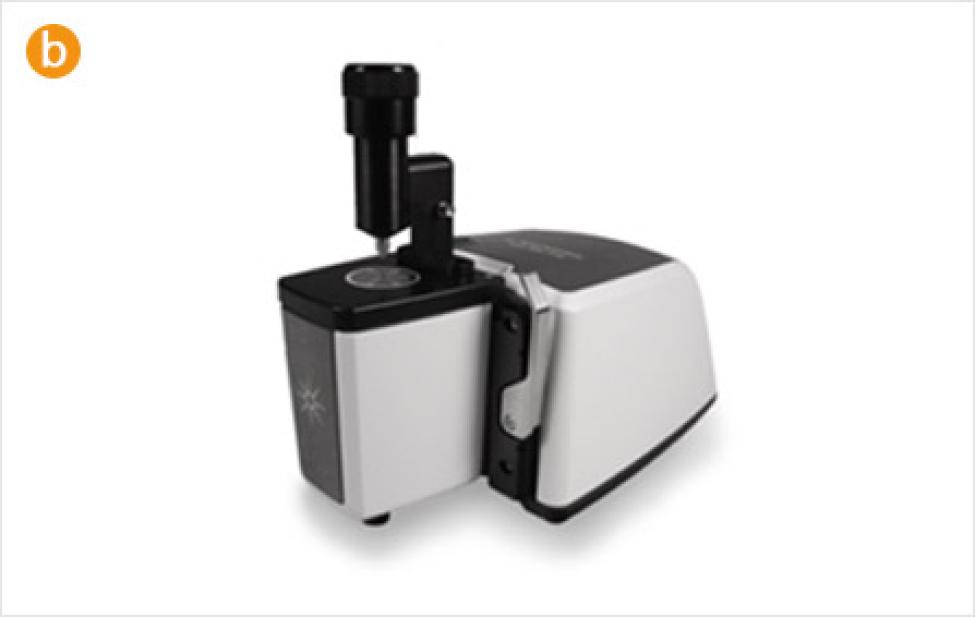
(b) FTIR (Agilent Technologies Cary 630)
Agilent Cary 630 is aDesktop Fourier Transform Infrared Spectrometerwith the characteristics of small size, easy operation, and quick measurement. The system is usually paired withATR (Attenuated Total Reflection) moduleFor measurement, the sample can be directly in contact with the crystal for analysis, without the need for complex sample preparation.
The equipment is suitable for the analysis of organic materials.Rapid component identification, analysis of organic functional groups, and comparison of organic materials.commonly used for process material verification, organic pollutant analysis, and quality inspection.
-
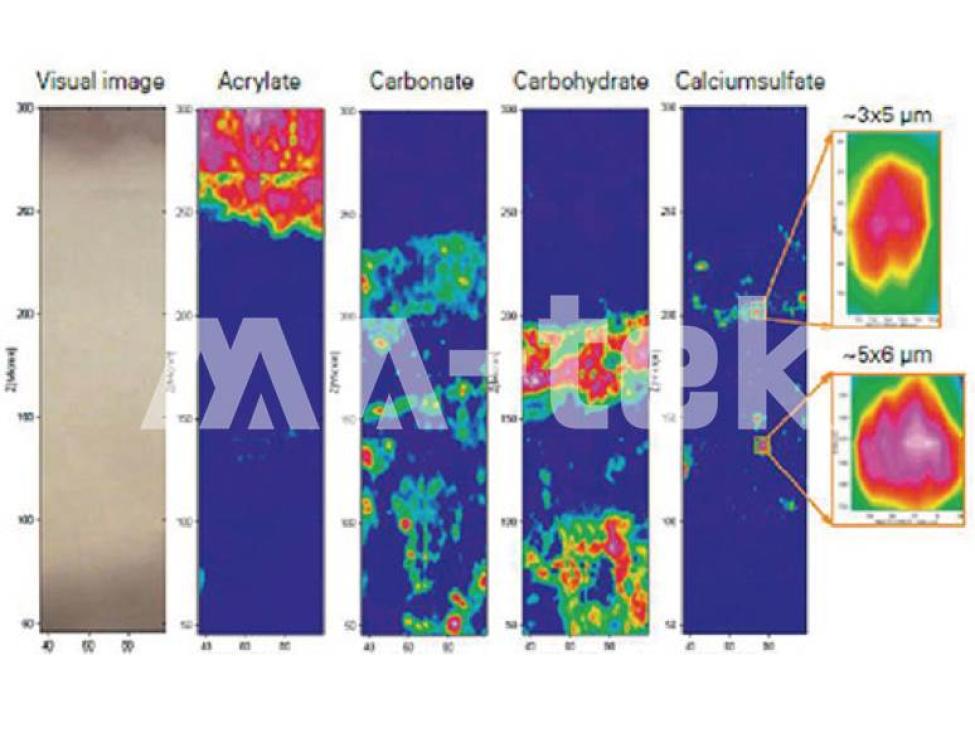
Mapping: The distribution of acrylate, carbonate, carbohydrate, and calcium sulfate.
-
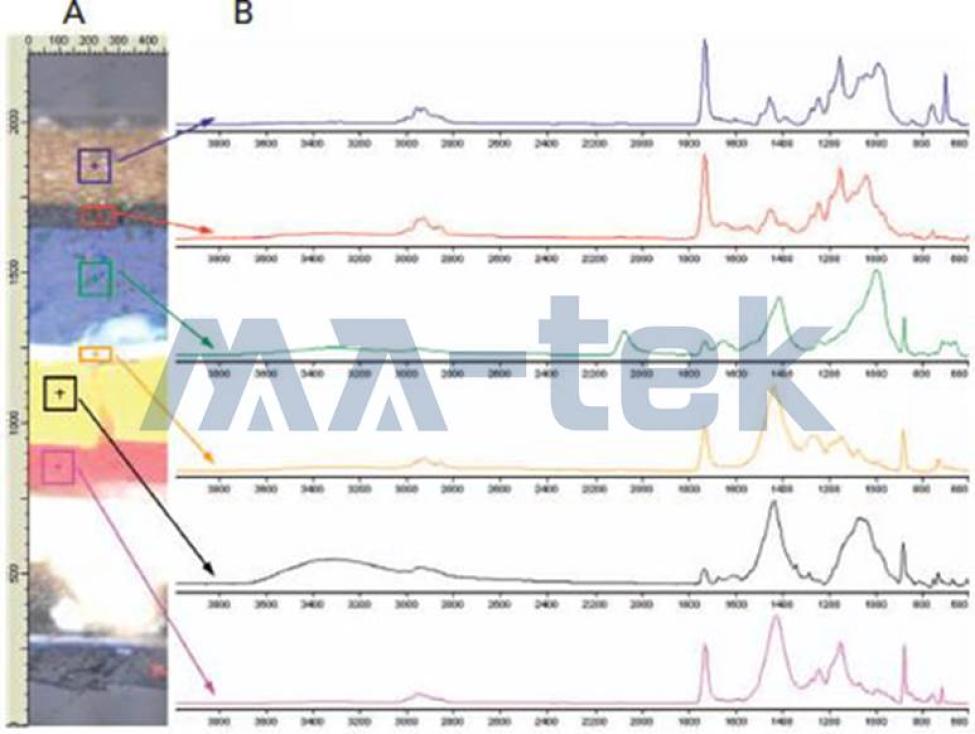
The corresponding FTIR spectra can be obtained by selecting any point on the mapping diagram.