
Energy-saving ferroelectric zirconium oxide in the theory and application of the energy field
Energy-saving ferroelectric zirconium hafnium oxide in theory and application in the energy field
Professor Li Min-hong, PhD student Wu Guan-ting, PhD student Liu Cheng-hong
National Taiwan University College of Technology and Research
-
1. Ferroelectricity of hafnium oxide (HfO2) film systems
In 2011, T. S. Böscke first published the ferroelectric (FE) and antiferroelectric (AFE) properties in Si-doped HfO₂ films as shown in Figure 1, and proposed that the ferroelectric phase of the hafnium oxide system is the orthorhombic phase. The formation of this phase occurs during the cooling process from the tetragonal phase, and Figure 2 is a schematic diagram of this [1]. Since the discovery of these properties in the HfO₂-based system, extensive research has been conducted on the applications of these materials. Subsequent findings attributed the ferroelectricity in HfO₂-based materials to the formation of a non-centrosymmetric orthorhombic phase (Pca2₁) [2], and the ferroelectric properties in HfO₂ can be induced by various dopants, such as silicon (Si), aluminum (Al), calcium (Ca), yttrium (Y), strontium (Sr), lutetium (Lu), gadolinium (Gd), and lanthanum (La), as well as the solid solution of HfO₂-ZrO₂ and undoped HfO₂. However, unlike ferroelectric behavior, HfO2The antiferroelectricity of the base material can only be formed through a limited number of elements for doping, such as aluminum (Al), silicon (Si), and the solid solution of HfO₂-ZrO₂, or doping aluminum (Al) and silicon (Si) into Hf₀.₅Zr₀.₅O₂. HfO2The antiferroelectric properties of the base material can be attributed to the phase transition between the non-polar tetragonal phase (P4₂/nmc) and the polar orthorhombic phase (Pca2₁) induced by the electric field, resulting in the formation of a double-loop hysteresis curve.
-
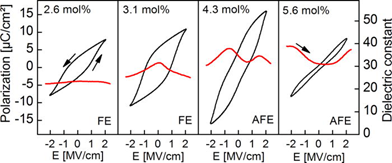 Figure 1. Capacitance and hysteresis curves at different Si doping concentrations [1]
 -
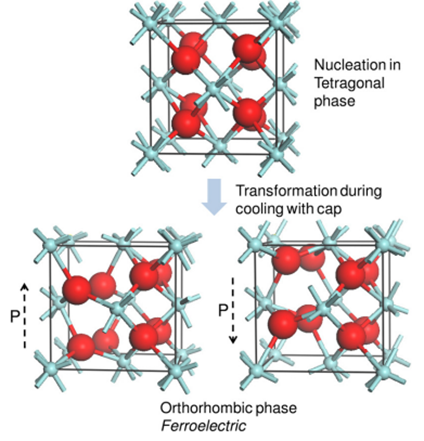 Figure 2. Schematic diagram of the transition from tetragonal phase to orthorhombic phase and the polarization states of different ferroelectric phases [1]
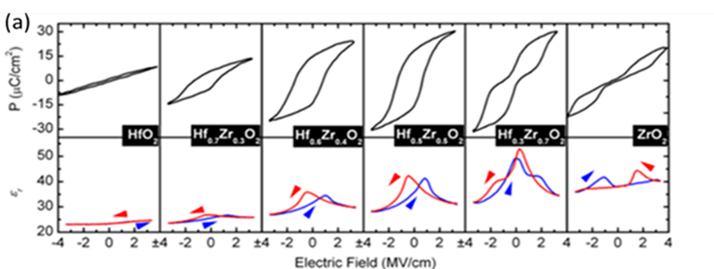
Figure 3 (a) Polarization and dielectric constant as a function of electric field for different Zr ratios [4]
2. Point group crystal structures of ferroelectric materials and piezoelectric, thermoelectric, and ferroelectric properties
Ferroelectric materials can only exist in crystals that lack an inverse center, that is, in non-centrosymmetric crystals. Among the 32 crystal point groups, all 32 groups exhibit dielectric properties, of which 21 are non-centrosymmetric groups. Among these, 20 can exhibit piezoelectricity (the point group 432 is excluded due to additional symmetry elements canceling the piezoelectric response). Such materials are referred to as piezoelectric materials. Among these, only 10 point groups have crystals that possess a permanent dipole moment, a characteristic known as spontaneous polarization, which can change uniformly with the temperature of the material. Therefore, these crystalline materials are classified as pyroelectric materials. Currently, there is no clear crystallographic classification to distinguish between pyroelectric materials and ferroelectric materials; the distinguishing criterion is that those with a permanent dipole moment, whose dipoles can be reoriented under an electric field less than the breakdown field, are classified as ferroelectric materials. In summary, all ferroelectric materials possess both pyroelectric and piezoelectric properties, but not all piezoelectric and pyroelectric materials exhibit ferroelectricity. The point groups that exhibit ferroelectricity, pyroelectricity, and piezoelectricity are shown in Figure 4. The hierarchical classification of ferroelectricity, pyroelectricity, and piezoelectricity is shown in Figure 5.
-
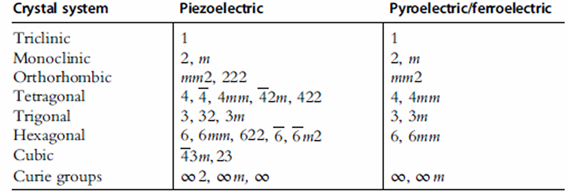 Figure 4. Point groups with ferroelectricity, thermoelectricity, and piezoelectricity [5]
 -
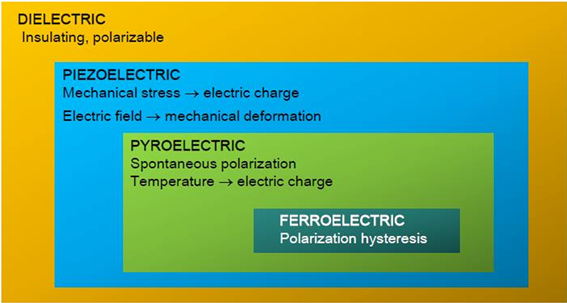 Figure 5. Hierarchical classification of ferroelectricity, thermoelectricity, and piezoelectricity [6]
3. The Physics of Ferroelectric Materials in Energy Applications
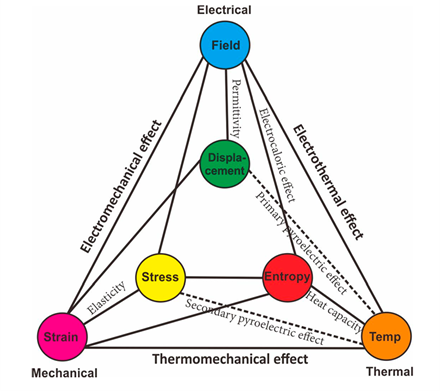
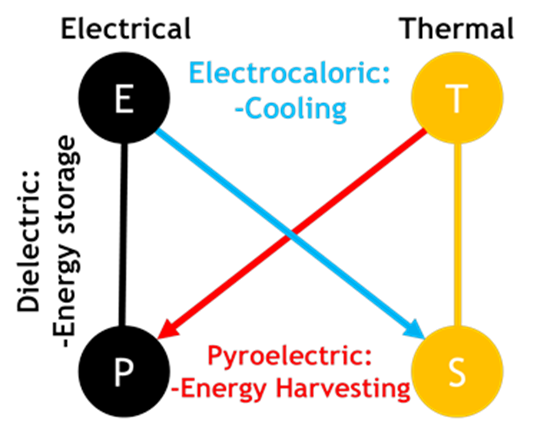
3-1 Introduction to the mechanism of electrostatic capacitance in energy storage
Regarding the application of electrostatic capacitance in energy storage, according to D. Zhou's team in the 2020 ACS Energy Materials journal, all types of linear and nonlinear dielectric materials' typical polarization behavior have been mentioned in past literature, including paraelectric (PE), linear (LE), ferroelectric (FE), relaxor ferroelectric (ReFE), and antiferroelectric (AFE). LE shows a linear proportional change in electric displacement with the external electric field as shown in Figure 8(a). PE can be polarized under an applied electric field, but when the electric field disappears, the material returns to a non-polar state as shown in Figure 8(b). FE can exhibit polarization even without an applied electric field, with a wider hysteresis loop as shown in Figure 8(c). ReFE greatly reduces the coupling between FE domains due to its limited spontaneous polarization, resulting in a contracted hysteresis loop as shown in Figure 8(d). AFE exhibits a double-loop hysteresis curve as shown in Figure 8(e).
The interaction between the electric field and polarization can be used for charge storage phenomena. Figure 9 shows the energy-storage density (ESD) and energy loss. During the charging process, energy is stored in the electrostatic capacitor, as shown in the blue and green areas. During the discharging process, the available ESD is released, as indicated by the green area. Through the additive relationship between the closed curves in the hysteresis loop of polarization electric field charge/discharge and the closed area between the polarization axis, the total energy of the dielectric material can be calculated.total)。
-
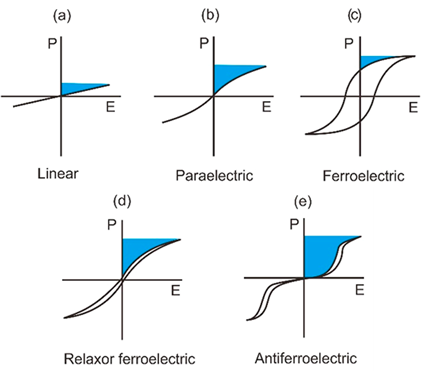 Figure 8. The performance of polarization electric field curves for different types of dielectric materials, with the blue area above the curve representing energy storage density.
 -
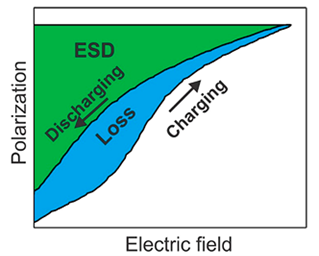 Figure 9. The relationship between the hysteresis loop and energy storage density and loss under the action of the polarization electric field for electrostatic capacitance.
3-2 Introduction to Pyroelectric Energy Harvesting Mechanism
Regarding electrostatic capacitance in energy harvesting, according to the C. Mart team at the 2020 IEEE International Electron Devices Meeting (IEDM) seminar, thermoelectric materials are applied to recover dissipated power and convert waste heat into electricity. As shown in Figure 10, the hysteresis curve exhibits a thermoelectric effect correlated with temperature. According to thermodynamics, temperature affects the energy barriers between different phases of ferroelectric materials at their stable states. As the temperature rises, phase transitions occur, with the ferroelectric orthorhombic phase transforming into the tetragonal phase, leading to a reduction in remnant polarization.
The Olsen team utilizes solid polar materials to apply this process to thermoelectrics, proposing the Olsen cycle to convert thermal energy into electrical energy. As shown in the polarization-electric field diagram (P-E diagram) in Figure 11(a), this process consists of four continuous steps: ⓐ Isothermal polarization: applying an electric field to polarize at a lower temperature environment, ⓑ Isoelectric heating: partial depolarization occurs during the heating process, ⓒ Isothermal depolarization: reducing the applied electric field to depolarize at a higher temperature environment, and ⓓ Isoelectric cooling: partial polarization occurs during the cooling process. Additionally, Figure 11(b) shows the corresponding temperature-entropy diagram (T-S diagram) of the system: ⓐ Entropy ejection, ⓑ Heat absorption, ⓒ Entropy absorption, and ⓓ Heat ejection. The polarization/depolarization phenomenon of thermoelectric materials refers to the release/absorption of entropy or heat in the system. From the isothermal reversible process in Figure 11(b), the amount of heat can be calculated through the product of entropy change (ΔS) and temperature (T). HED is the harvestable energy density.HIt is a high applied electric field, EL is the low applied electric field, TLis a relatively low temperature environment, THis a relatively high temperature environment, therefore, in the case of a single Olsen cycle loop, the heat absorbed (THΔS) is greater than the released heat (TLΔS) represents the heat absorbed that can be converted into electrical energy. The conditions required for efficient thermoelectric energy harvesting are as follows: (i) larger harvestable energy density (HED), (ii) lead-free properties, (iii) nanofilm structure, (iv) high melting point, and (v) breakdown voltage. Ferroelectric materials with a fluorite structure, such as HZO, are lead-free and can exhibit ferroelectricity in nanofilms, as well as having a wider range of phase changes, a larger band gap (~ 5.5 eV), and a high breakdown electric field, making them one of the candidates for thermoelectric materials.
-
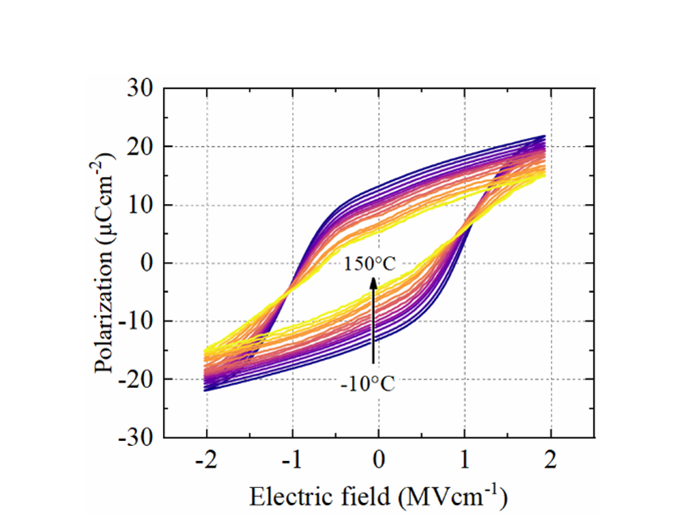 Figure 10. In the relationship of polarization electric field, the thermoelectric effect causes changes in the hysteresis loop.
 -
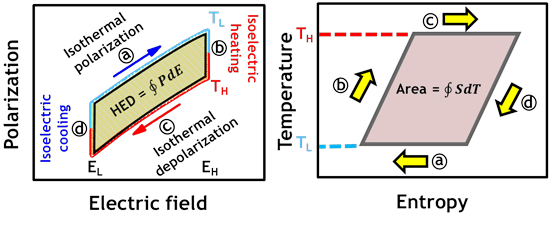 Figure 11. (a) The relationship between polarization and electric field explains the Olsen cycle. (b) The steps of the cycle correspond to the relationship between temperature and entropy.
3-3 Electrocaloric Solid-state Cooling Physics
According to the M.-H. Park team in the 2016 Advanced Materials journal [18], ferroelectric hafnium zirconate (Hf1-xZrxO2The concept of using thin films for cooling materials, where the important parameters of the electrocaloric effect (ECE) are temperature change (ΔT) and entropy change (ΔS), depend on (∂P/∂T).EThe change, which is the variation of polarization-temperature under a fixed electric field shown in Figure 12 (slope), is presented in Figures 13(a) and (b). The calculated ΔT and ΔS for different concentrations of hafnium zirconate are positive. When the slope is negative, the entropy decreases with the increase of the electric field, and the material releases heat, achieving a cooling effect. This phenomenon is contrary to the previously mentioned Olsen cycle and is also known as the Inverse-Olsen cycle. Conversely, when the slope is positive, the entropy increases with the increase of the electric field, and the material absorbs heat, achieving a heating effect (environmental cooling). This phenomenon is similar to the Olsen cycle and is also known as the Negative Electrocaloric Effect. The refrigerant capacity RC is calculated, as shown in Figure 13(c).Currently, there is still no clear and perfect theoretical model that fully explains the ferroelectric/antiferroelectric electric card and negative electric card effects in hafnium zirconate films. However, according to theory, ferroelectric materials have high feasibility in the cooling applications of advanced process technology, and even combine positive and negative electric card effects to achieve a cyclic cooling effect.
-
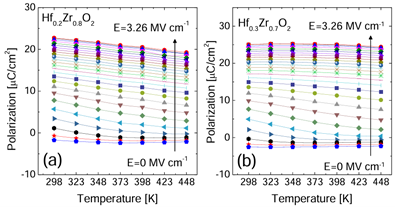 Figure 12. Polarization of hafnium zirconium oxide films as a function of temperature, (a) Hf0.2Zr0.8O2、(b) Hf0.3Zr0.7O2The slope of the polarization as a function of temperature is negative.
 -
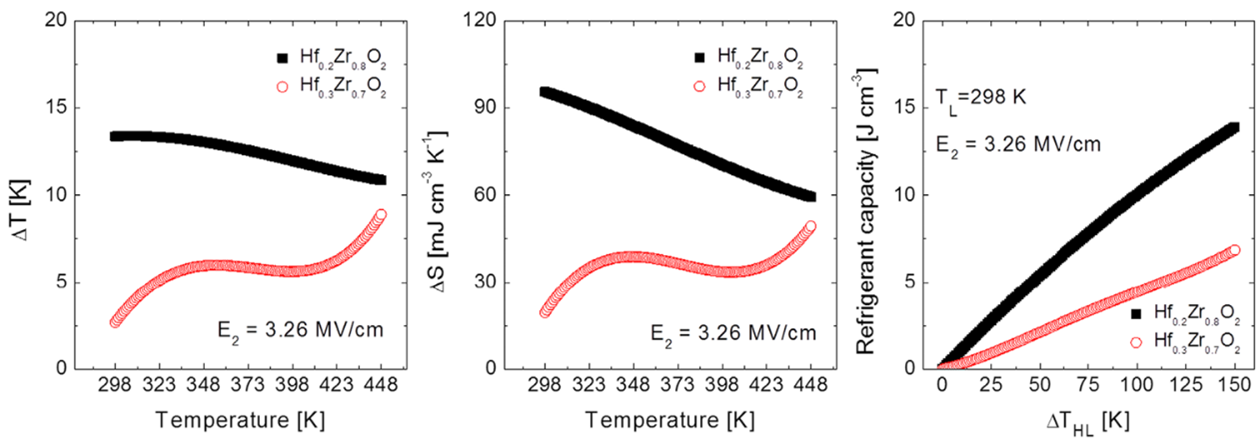 Figure 13. Organize the data from Figure 12: (a) temperature change (ΔT) and (b) entropy change (ΔS), and calculate (c) Refrigerant Capacity (RC). [18]
4. Ferroelectric Zirconium Hafnium Oxide in Energy Applications
From the previous discussion, it can be seen that the formation of the non-centrosymmetric Pca21 orthorhombic phase in zirconium hafnium oxide exhibits ferroelectric and antiferroelectric properties. Ferroelectric materials are a type of thermoelectric material, so their electrical properties, thermal properties, and the interactions between polarization and entropy can be utilized to achieve applications in energy storage, energy harvesting, and thermoelectric cooling. Therefore, this chapter will approach from the application perspective, introducing the practical applications of zirconium hafnium oxide integrated with CMOS in the energy field, along with research on improvements in ferroelectric engineering.
4-1 Three-dimensional antiferroelectric energy storage capacitor
Compared to the linear P-E relationship of ferroelectric films, antiferroelectric films exhibit a nonlinear P-E relationship. Due to this P-E characteristic, antiferroelectric materials can store more electrostatic energy than ordinary dielectric materials, making them an ideal choice for applications in electrostatic supercapacitors. Figure 14(a) illustrates the P-V hysteresis curve and presents important energy storage indicators for antiferroelectric materials in supercapacitor applications. The ESD region represents the recoverable stored energy, known as energy storage density (ESD), while the Loss region indicates the unrecoverable energy loss due to polarization reversal. In addition, the efficiency of energy storage devices (ESE, Energy Storage Efficiency) can be calculated using the ratio of ESD to the total energy loss.
According to the team of Milan Pešic´, a 3D integration of TiN/ZrO₂/Al₂O₃/ZrO₂/TiN energy storage capacitors compatible with CMOS processes was published in the 2016 issue of Advanced Functional Materials [22]. Figure 14 shows the P-V characteristics of planar and 3D ZrO₂ anti-ferroelectric capacitors. For planar supercapacitors, an energy storage density (ESD) of 37 J/cm³ was achieved, with an energy storage efficiency (ESE) of 51%. Since the total stored charge of the capacitor is proportional to the area, the material can stack a 3D MIM (Metal-Insulator-Metal) capacitor structure, achieving an increase in storage density per unit chip area. In the 46 nm process node 6F² DRAM, with an aspect ratio of 30:1, an energy storage density (ESD) of 930 J/cm³ can be achieved, and the efficiency (ESE) can reach 70%, as shown in Figure 14(c). Detailed information can be found in reference [17]. Figure 14(b) shows the TEM cross-section of this supercapacitor.
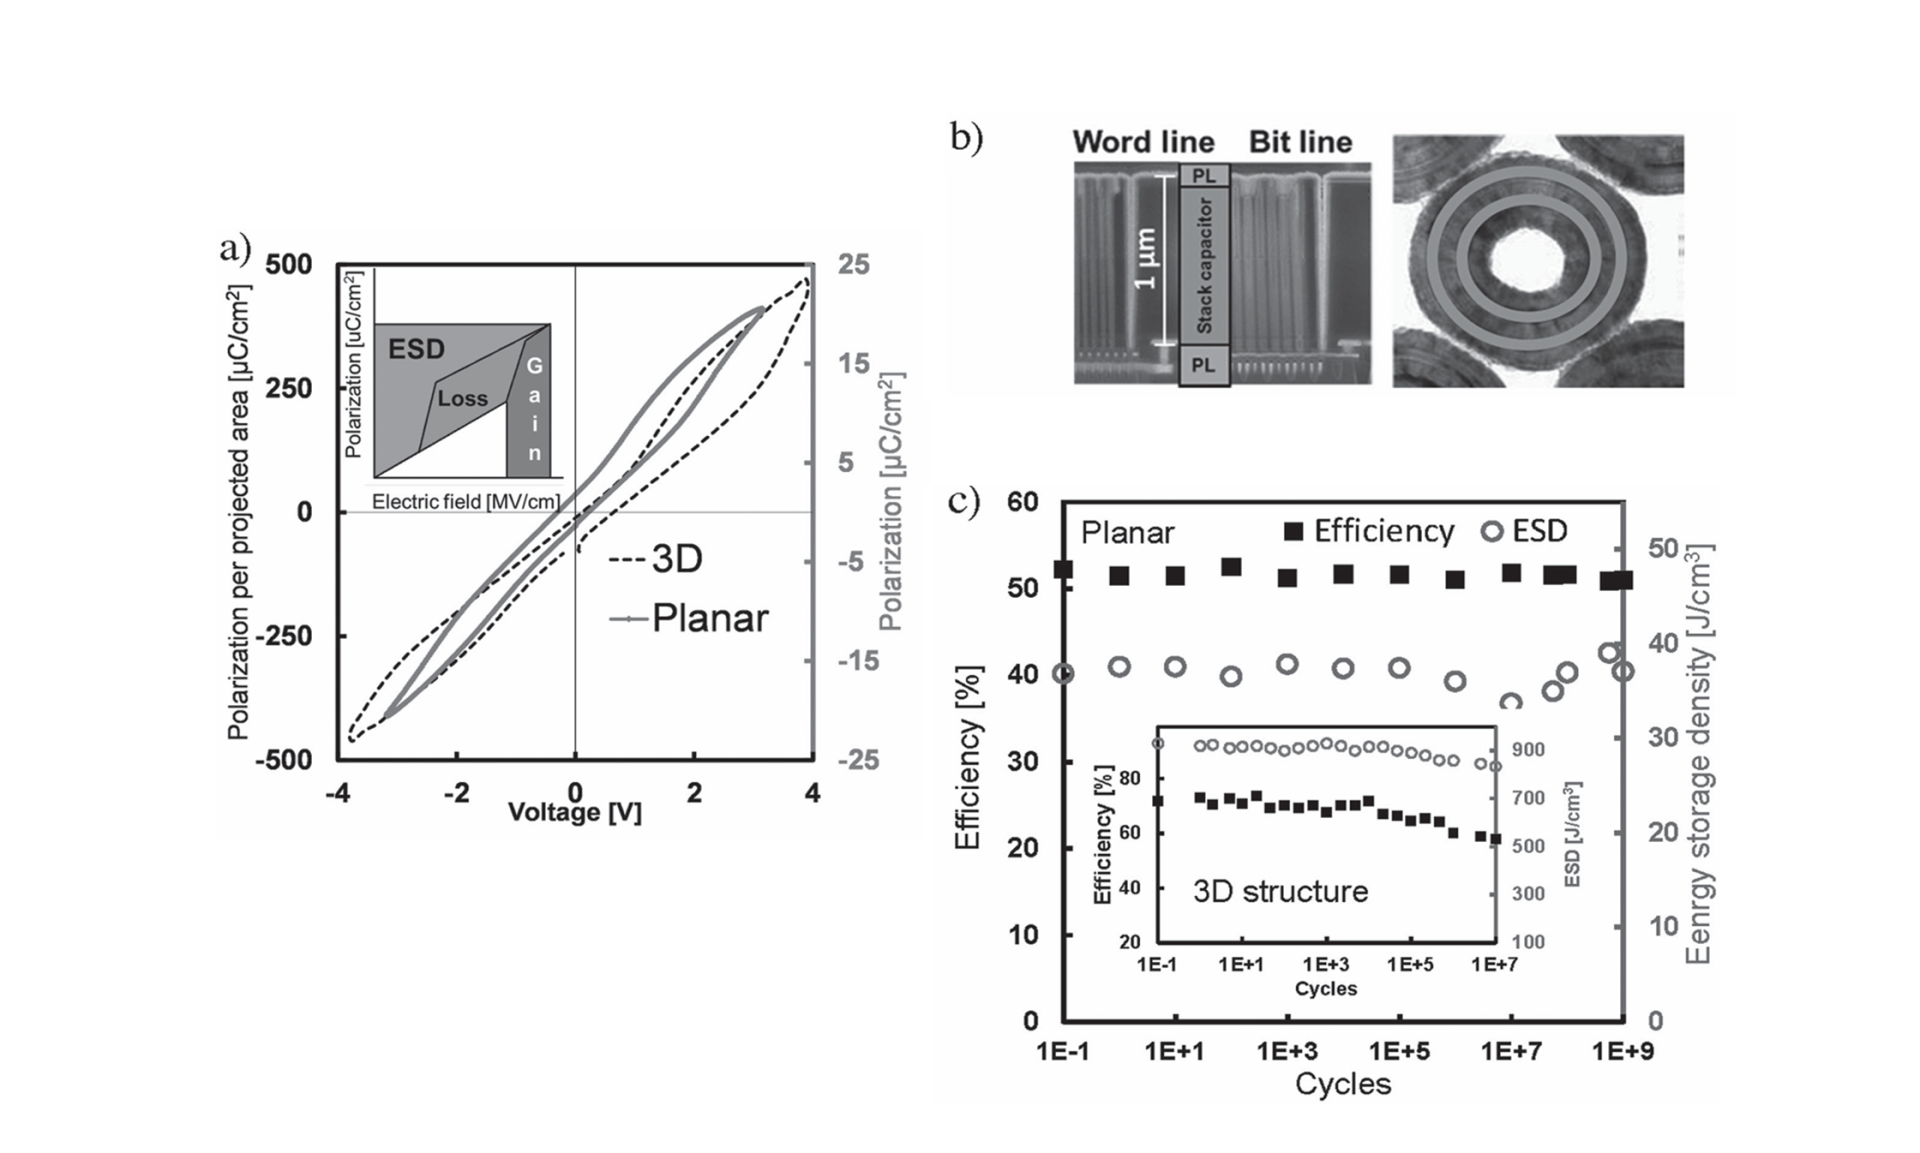 Figure 14. The team of Milan Pešic´ published a 3D integration of TiN/ZrO₂/Al₂O₃/ZrO₂/TiN energy storage capacitors compatible with CMOS processes in the journal Advanced Functional Materials in 2016. (a) P-V of planar and 3D ZrO₂ anti-ferroelectric capacitors, (b) is the TEM cross-section of this supercapacitor. (c) In a 46 nm process node 6F² DRAM, with an aspect ratio of 30:1, an energy storage density (ESD) of 930 J/cm³ can be achieved with an efficiency (ESE) of up to 70%. [22]
4-2 3D ferroelectric/antiferroelectric energy storage capacitor film thickness composition and annealing conditions optimization
The Yuli He team published the concept of FE/AFE bilayer dielectric materials for energy storage capacitors in the 2022 Nanoscale Advances journal, and explored the effects of the thickness composition and annealing conditions of FE-Hf₀.₅Zr₀.₅O₂ and AFE-Hf₀.₂₅Zr₀.₇₅O₂ thin films on capacitance characteristics. This study used PE-ALD to fabricate TiN electrodes for the FE-Hf₀.₅Zr₀.₅O₂/AFE-Hf₀.₂₅Zr₀.₇₅O₂ capacitor, optimizing the FE/AFE thickness composition and annealing conditions. As shown in Figure 15, after annealing at 450°C for 30 minutes, the energy storage efficiency (ESE) and maximum energy storage density (ESD) of different FE/AFE combination capacitors were measured. The FE (1 nm)/AFE (9 nm) combination exhibited the highest ESD of 71.93 J/cm³, with an ESE of 57.6%. Further experiments were conducted on the FE (1 nm)/AFE (9 nm) stacked capacitors under various annealing conditions, as shown in Figure 16 (a). The maximum value of 57.6% was reached after annealing at 450°C for 30 minutes. Figure 16 (b) shows that when the annealing time is maintained between 30 to 70 minutes, the maximum ESD and ESE obtained remained around 71.93 J/cm³ and 57.6%, respectively. For the FE (1 nm)/AFE (9 nm) stacked capacitor, annealing at 450°C for 30 minutes can be considered the optimal annealing condition.
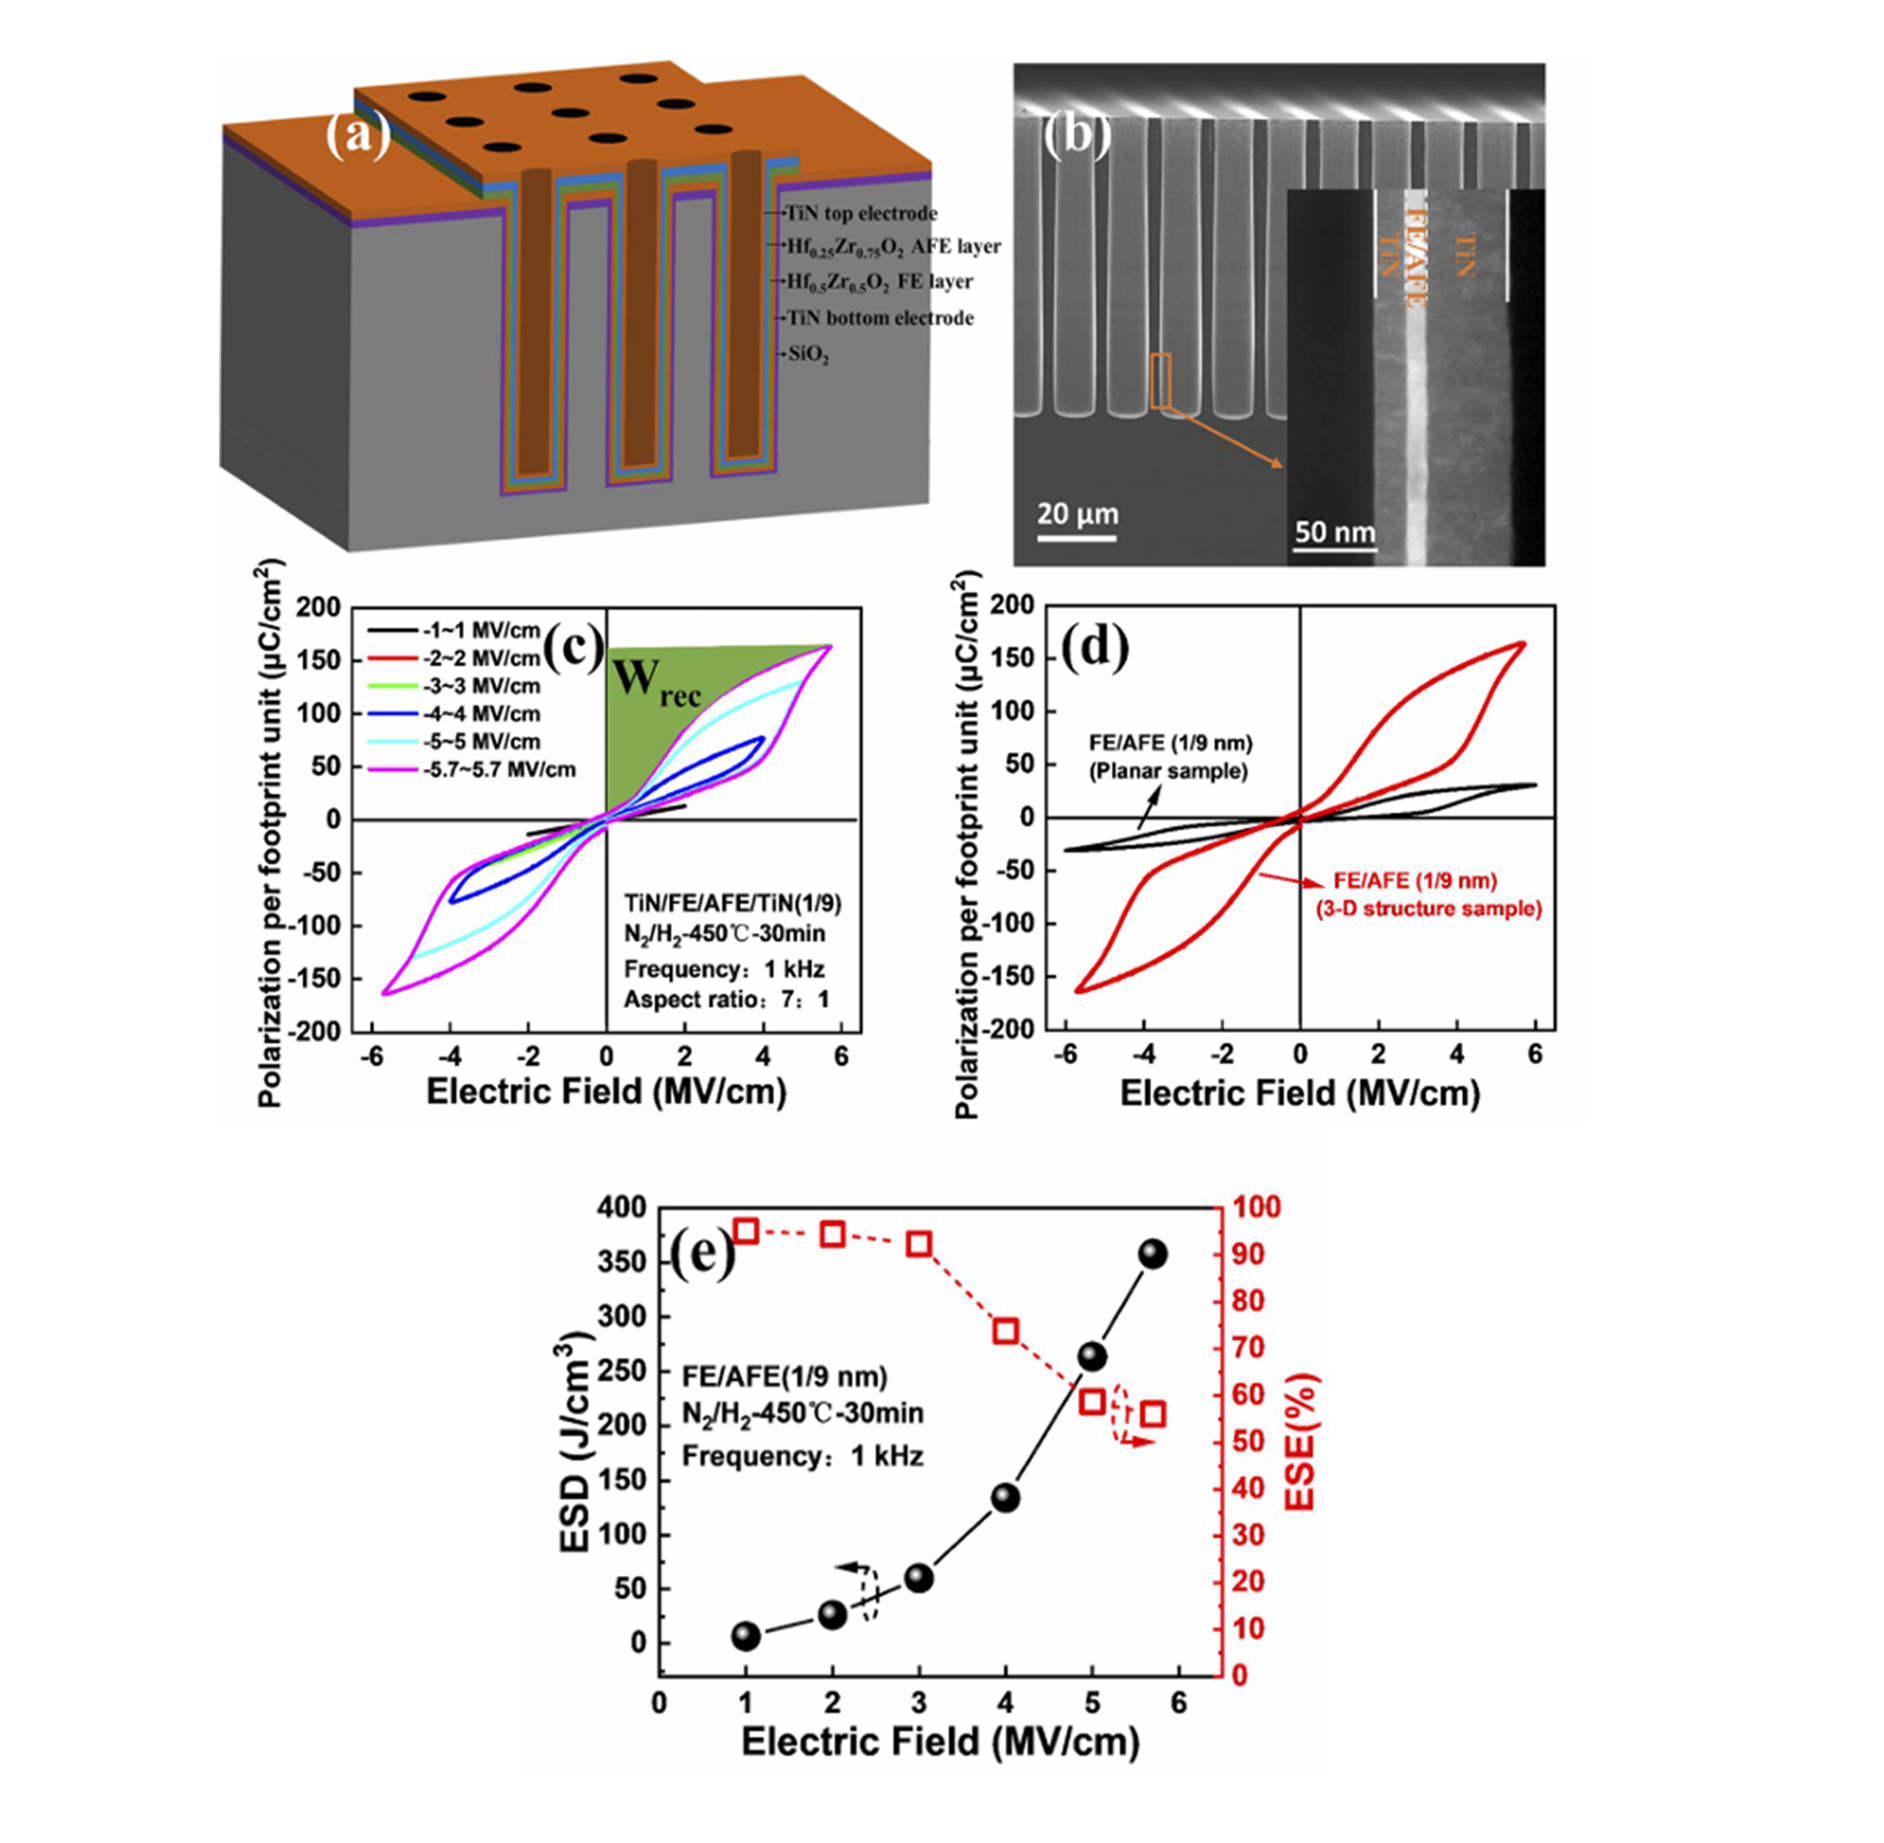
By integrating capacitance into a three-dimensional structure, the actual surface area of the electrodes can be significantly increased, greatly enhancing the unit area ESD. Figure 17(a) is a schematic diagram of the three-dimensional capacitor, and Figure 17(b) is the corresponding cross-sectional SEM image, showing vertical grooves on the side walls with a depth-to-width ratio of 7:1. Figure 17(c) shows that the maximum polarization per unit area of the P-E hysteresis curve increases from 13.3 mC/cm² to 163.2 mC/cm², with the green area indicating the recoverable ESD. Figure 17(d) demonstrates a significant increase in polarization per unit area of the three-dimensional groove capacitor compared to the planar capacitor. The ESD in Figure 17(e) increases from 6.45 to 358.14 J/cm³, while the ESE decreases from 95% to 56%. Notably, when the applied electric field exceeds 3 MV/cm, the ESE significantly decreases due to the expansion of the P-E hysteresis curve, leading to larger hysteresis losses.
-
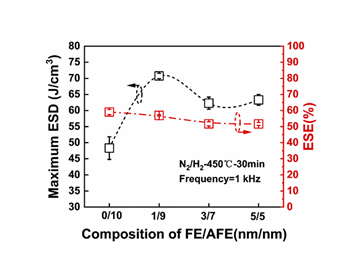 Figure 15. Maximum energy storage density (ESD) of capacitors with different FE/AFE thickness combinations and corresponding energy storage efficiency (ESE) [23]
 -
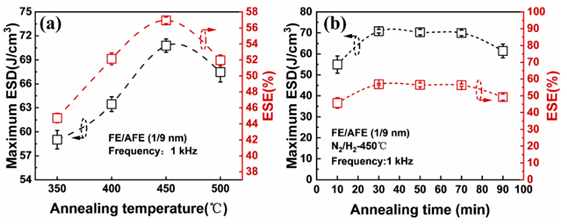 Figure 16. The maximum energy storage density (ESD) and corresponding energy storage efficiency (ESE) of the FE (1 nm)/AFE (9 nm) stack (a) under different annealing temperatures after 30 minutes of annealing (b) under different annealing times at 450°C.
4-3 Back-end-of-line (BEOL) compatible thermoelectric energy harvesting
According to the C. Mart team, at the 2020 IEEE International Electron Devices Meeting (IEDM) [15], they presented a feasible method for thermoelectric energy harvesting using thermoelectric hafnium zirconium oxide materials compatible with backend processes, converting waste heat dissipated by integrated circuits into electrical energy, as shown in Figure 18(a). Figure 18(b) shows a metal-insulator-metal (MIM) capacitor compatible with backend processes, with a 10 nm Hf₁₋ₓZrₓO₂ hafnium zirconium oxide thin film. The thermoelectric characteristics of Hf₁₋ₓZrₓO₂ materials are achieved through the Olsen cycle, as shown in Figure 11. To simulate the power consumption of integrated circuits, this team adopted an internally integrated heating test structure, as shown in Figure 19. For detailed process information, please refer to reference [25]. The simulated actual thermal power density range for integrated circuits is from 36 W/cm² to 144 W/cm².
-
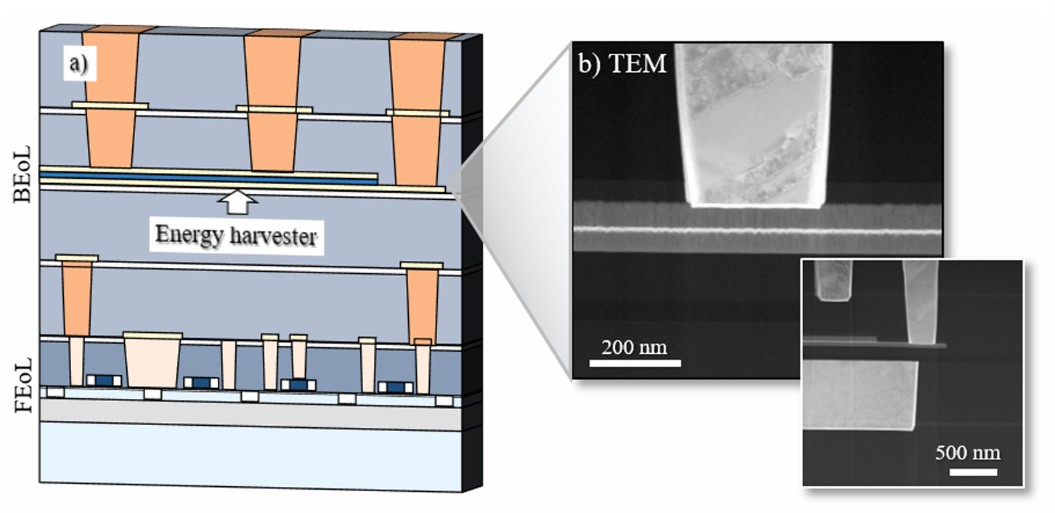 Figure 18 (a) Schematic diagram of the thermoelectric HfO₂-based energy harvesting device (b) TEM image of HfO₂-based capacitors integrated into BEOL [15]
 -
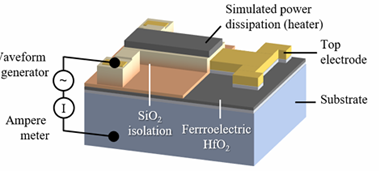 Figure 19. Test structure for energy harvesting experiments simulating power dissipation conditions in integrated circuits [15]
Figure 20 shows the variation of polarization and voltage under different thermal power dissipation, and this curve is very similar to the target Olsen loop. The energy harvesting shown in Figure 21 can only be completed in the positively polarized state. Figure 22 shows that as the operating frequency increases, the resistance loss at the circuit connection becomes significant, resulting in a decrease in energy density. At an operating frequency of 549 Hz, it can reach up to 92.4 mW/cm³. Figure 23 shows the large-scale collection efficiency (η/η) at low frequency limits.CarnotIt can reach 52%. The upper limit of the operating frequency depends on the resistance loss of the TiN electrode; this factor is identified as a key influence on the efficiency of energy harvesting devices at high frequencies.
-
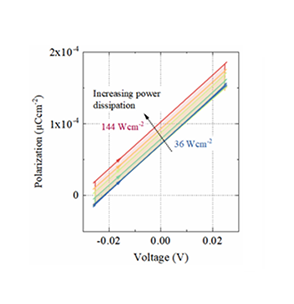 Figure 20. The thermal energy dissipation in the Olsen loop increases, and the area enclosed by its curve also increases.
 -
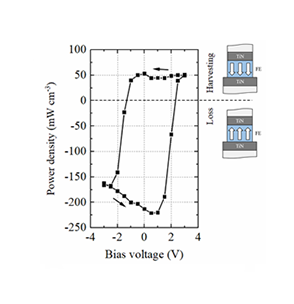 Figure 21. The change of DC electric field bias in thermoelectric materials can stably operate under downward polarization. The switching phenomenon of ferroelectric HfO₂ materials is clearly visible [15].
-
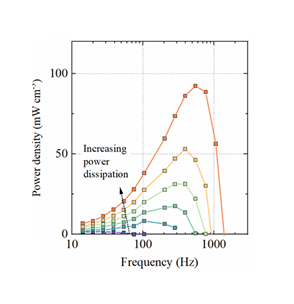 Figure 22. The relationship between the collected power density and operating frequency at different amplitudes of dissipated thermal power [15]
 -
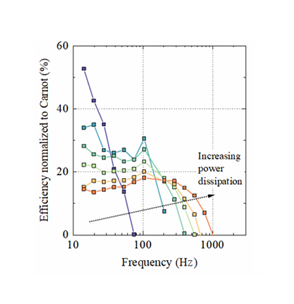 Figure 23. The graph of the normalized Carnot efficiency varying with frequency under different amplitudes of dissipated thermal power [15]
Energy storage and thermoelectric energy harvesting of zirconium hafnium oxide in extreme environments with large temperature differences
According to the tests conducted by this laboratory on electrostatic energy storage (EES) and thermoelectric energy harvesting (PEH) achieved through the Oslen loop, presented at the 2024 IEEE International Electron Devices Meeting (IEDM) [27], the characteristics of Hf₁₋ₓZrₓO₂ materials with different Zr concentrations were verified.
This study uses a metal-insulator-metal (MIM) structure to fabricate ferroelectric (FE) and antiferroelectric (AFE) capacitors with 10 nm Hf₁₋ₓZrₓO₂ (HZO) films. The composition of HZO is controlled through the supercycle deposition technique of HfO₂ and ZrO₂, where the deposition ratios corresponding to FE, partial antiferroelectric (P-AFE), and complete antiferroelectric (F-AFE) are 1:1, 1:3, and 1:9, respectively.
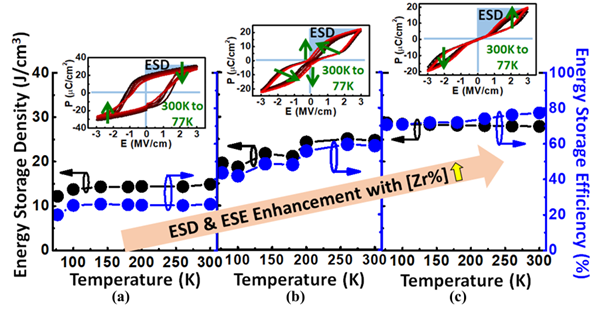
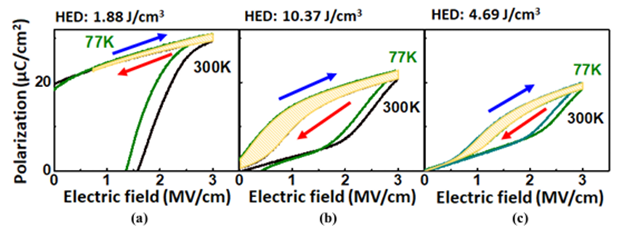
Polarization characteristic measurements of FE, P-AFE, and F-AFE materials were conducted in the range of 300K (room temperature 27°C) to 77K (-196°C). As shown in Figure 24, FE materials exhibit a larger remnant polarization (Pr), its ESD and ESE are relatively low, which is precisely the advantage of AFE materials. In particular, F-AFE materials can minimize energy loss in the range from room temperature to 77K, with an ESE exceeding 70% and an ESD exceeding 25 J/cm³. In terms of temperature entropy, the Olsen cycle schematic illustrates the coupling of electrical and thermal characteristics during the energy harvesting process, as shown in Figure 11, where the clockwise direction represents pyroelectric energy harvesting, and the counterclockwise direction is used for thermoelectric cooling. As shown in Figure 25 TL and THare 77K and 300K (room temperature), with a temperature difference of ΔT. By increasing ΔT and the electric field, HED can be further optimized; the HED of some antiferroelectric (P-AFE) materials can reach up to 10.37 J/cm³, while the HED of FE materials is limited by EL at 0.75 MV/cm and P.SThe limitations with smaller differences. For P-AFE and F-AFE materials, as the temperature decreases from 300K to 77K, their PSSignificantly reduced, allowing the HED area to extend to the minimum electric field (0 MV/cm), thereby enabling the P-AFE material to achieve a maximum HED of 10.38 J/cm³.
5. Summary
The crystal structure characteristics of ferroelectric materials allow for thermodynamic reversible interactions between electrical, thermal, and mechanical variables. Fluorite-structured ferroelectric materials such as HZO exhibit ferroelectricity in nano films, along with a broader range of phase changes, a large energy gap of ~ 5.5 eV, and a high breakdown electric field, making them one of the candidates for thermoelectric materials. The coupling between the electrical and thermal characteristics of ferroelectric hafnium-based oxides demonstrates great potential in energy storage, thermoelectric energy harvesting, and thermoelectric cooling applications. In future process nodes of Intel and TSMC, the Backside Power Delivery Network (BS-PDN) may have potential issues with thermal distribution. If this waste heat can be recovered and reused as a power source, or if the thermoelectric effect can be utilized to lower chip temperatures, integrating it with high-power chips could lead to significant improvements in energy efficiency.
References:
[1] T. S. Böscke et al., Appl. Phys. Lett. 99, 102903 (2011)
[2] X. Sang et al., Appl. Phys. Lett. 106, 162905 (2015)
[3] R. Materlik et al., J. Appl. Phys. 117, 134109 (2015)
[4] J. Müller et al., Nano Lett. 12, 8, 4318–4323 (2012)
[5] U. Schroeder et al., Duxford: Woodhead Publishing, First edition, (2019)
[6] T. Mikolajick et al., IEEE IEDM. Short course 2 (2017)
[7] S. G. Lu et al., Appl. Phys. Lett. 97, 202901 (2010)
[8] X. Li et al., J. Mater. Chem. C 1 (1), 23−37. (2013)
[9] F. Ali et al., ACS Appl. Electron. Mater. 2, 8, 2301–2317 (2020)
[10] M. H. Park et al., Nano Energy, 12, 131–140 (2015)
[11] F. Ali et al., ACS Appl. Energy Mater. 3, 7, 6036–6055 (2020)
[12] Z. Yao et al., Adv. Mater. 29, 1601727 (2017)
[13] R. Su et al., Polymer, 53, 728−739, (2012)
[14] S. Tong et al., ACS Appl. Mater. Interfaces 5, 4, 1474–1480 (2013)
[15] C. Mart et al., IEEE IEDM, 561 (2020)
[16] M. H. Park et al., Phys. Status Solidi RRL 13, 1900177 (2019)
[17] R. B. Olsen et al., J. Appl. Phys. 58, 4709–4716 (1985)
[18] M. H. Park et al., Adv. Mater. 28, 7956–7961 (2016)
[19] B. Ma et al., J. Mater. Res. 24, 2993 (2009)
[20] J. Li et al., J. Mater. Chem. 22, 23468–23476 (2012)
[21] M. H. Park et al., Adv. Ene. Mater. 4, 1400610 (2014)
[22] M. Pešic´et al., Adv. Funct. Mater. 26, 7486–7494 (2016)
[23] Y. He et al., Nanoscale Adv. 4, 4648-4657 (2022)
[24] K. D. Kim et al., Nano Energy 39, 390-399 (2017)
[25] C. Mart et al., Appl. Phys. Lett. 113, 122901 (2018)
[26] C. B. Vining et al., Nat. Mater. 8, 83-85 (2009)
[27] C. H. Liu et al., IEEE IEDM, 27-4 (2025)